Breaking News

Performing Pulse Code Modulation and Demodulation using MATLAB Code

This is a MATLAB code for performing Pulse Code Modulation (PCM) on an analog signal. The code generates an analog signal, samples it, quantizes it, encodes it, and finally demodulates it back to obtain the original analog signal. Here is the complete code:

function pcm()
clc;
close all;
clear all;

n=input('Enter n value for n-bit PCM system :  ');
n1=input('Enter number of samples in a period : ');
L=2^n;

% % Signal Generation
x=0:2*pi/n1:4*pi;               
% n1 number of samples have to be selected
s=4*sin(x);
subplot(4,1,1);
plot(s);
title('Analog Signal');
ylabel('Amplitude--->');
xlabel('Time--->');

subplot(4,1,2);
stem(s);grid on;  
title('Sampled Signal');  
ylabel('Amplitude--->'); 
xlabel('Time--->');

 %  Quantization Process

 vmax=10;
 vmin=-vmax;
 del=(vmax-vmin)/L;
 part=vmin:del:vmax;                                 

 % level are between vmin and vmax with difference of del

 code=vmin-(del/2):del:vmax+(del/2);        

% Contaion Quantized values 

 [ind,q]=quantiz(s,part,code); 
                    
% Quantization process                                                              
% ind contain index number and q contain quantized  values

 l1=length(ind);
 l2=length(q);
  
 for i=1:l1
    if(ind(i)==0)                                            

           % To make index as binary decimal so started from 0 to N

       ind(i)=ind(i)-1;
    end 
  
 end   
  for i=1:l2
     if(q(i)==vmin-(del/2))    
                      
             % To make quantize value in between the levels

         q(i)=vmin+(del/2);
     end
 end    


 subplot(4,1,3);
 stem(q);
grid on;                       % Display the Quantize values
 title('Quantized Signal');
 ylabel('Amplitude--->');
 xlabel('Time--->'); 

 %  Encoding Process

 figure
 code=de2bi(ind,'left-msb');        % Convert the decimal to binary
 k=1;
for i=1:l1
    for j=1:n
        coded(k)=code(i,j);  
         
        % convert code matrix to a coded row vector

        k=k+1;
    end

end

 subplot(2,1,1);
 grid on;
 stairs(coded);                 % Display the encoded signal
axis([0 100 -2 3]); 
 title('Encoded Signal');
 ylabel('Amplitude--->');
 xlabel('Time--->');

 %   Demodulation Of PCM signal

 qunt=reshape(coded,n,length(coded)/n);
 index=bi2de(qunt','left-msb');         % Get back the index in decimal form
 q=del*index+vmin+(del/2);            % Get back Quantized values
 subplot(4,1,4); 
 plot(q);                                            % Plot Demodulated signal
 title('Demodulated Signal');
 ylabel('Amplitude--->');
 xlabel('Time--->');
end

Read more ...

What do you mean by Constellation Diagrams in Communication Systems?

A constellation diagram is a graphical representation of a signal modulated by a digital modulation scheme such as quadrature amplitude modulation or phase-shift keying(QAM/QPSK). It shows the signal constellation, which is a set of complex numbers that represent the possible signal values in a modulation scheme.

In a constellation diagram, each point represents a symbol, and the location of the point in the complex plane represents the phase and amplitude of the corresponding signal. The horizontal axis represents the in-phase (I) component of the signal, and the vertical axis represents the quadrature (Q) component of the signal.

The constellation diagram is a useful tool for analyzing the performance of a communication system. Measured constellation diagrams can be used to recognize the type of interference and distortion in a signal. It can be used to visualize the effects of noise and other impairments on the transmitted signal. By analyzing the distribution of points in the constellation diagram, engineers can evaluate the quality of the signal and make adjustments to improve the performance of the system.
Read more ...

Sampling Theorem Statement

Sampling theorem state that the bandpass signal x(t) whose maximum bandwidth is 2w can be completely represented into and recovered from its samples, if it is sampled at the minimum rate of twice the bandwidth.
Read more ...

Comparison of PCM, DM, and ADM: Which one is the best for digital communication?

When the analog signal is sampled, it can be quantized and encoded by any one of the following techniques-

        i) Pulse code modulation (PCM)
        ii) Delta Modulation (DM)
       iii) Differential pulse code modulation (DPCM)

These techniques convert an analog pulse to its digital equivalent. The digital information is then transmitted over the channel. The major difference among the techniques are given below:

PCM is a digital pulse modulation technique where an analog signal is sampled and quantized to a discrete signal. The analog signal is first sampled at regular intervals and then quantized to the nearest level. PCM has the advantage of having a simple implementation and being able to achieve high signal-to-noise ratios. However, it requires high bandwidth and is sensitive to quantization errors.

Delta modulation (DM) is a digital pulse modulation technique that approximates the waveform of the analog signal by a series of pulses. DM samples the analog signal and then compares the present sample with the previous sample to determine the next pulse. DM has a simple structure and requires low bandwidth. However, it has poor performance in low signal-to-noise ratio conditions and produces high quantization noise.

Adaptive Delta Modulation (ADM) is an improved version of DM that adjusts the step size of the quantization to track the changes in the input signal. ADM overcomes the limitations of DM and produces better performance in low signal-to-noise ratio conditions. However, ADM requires more complex implementation and is more sensitive to changes in the input signal.

In summary, PCM is suitable for high signal-to-noise ratio conditions, DM is appropriate for low bandwidth and low-complexity applications, and ADM is ideal for low signal-to-noise ratio conditions. The choice of which technique to use depends on the specific requirements of the application.


Read more ...

Nodal Analysis of an Electric Circuit: Finding Node Voltages and Branch Currents

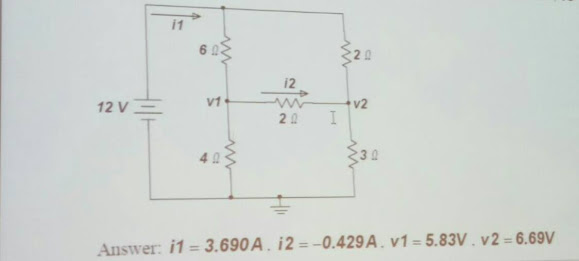
Find the node voltages and branch currents of the following electric circuit using nodal analysis:

electric circuit to find node voltages and brunch currents

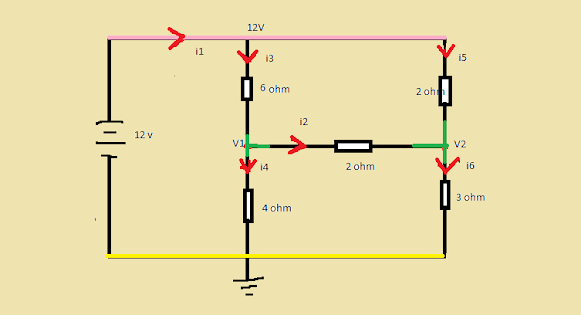
According to the method of Nodal analysis, first of all we need to determine all the nodes of the circuit.  Then select the reference node which must be located to ground. After all denote all the unknown node voltages and all the branch currents.  Now the modified circuit looks like below:

nodal analysis

Here we have four nodes in the circuit. The reference node is represented by yellow node. The pink color node voltage is known. So remaining two unknown nodes are represented by green color. 

The tricks is that the number of equations need to solve the problem equal to the number of unknown nodes. 

According to KCL, we get-

    
Read more ...
Designed By